
In today’s data-driven world, the ability to organize, analyse, and present information effectively is an essential skill for students. Whether you’re tracking grades, summarizing survey results, or preparing for a career in data analysis, mastering Pivot Tables can save you time and make your work shine. This blog will demystify Pivot Tables and provide a step-by-step guide to get started.
What Are Pivot Tables?
Imagine a tool that can instantly transform a massive spreadsheet into a clear summary of trends and insights – this is exactly what Pivot Tables do. A Pivot Table allows you to rearrange, group, and summarize data with just a few clicks, giving you meaningful insights without complicated formulas.
For example, if you have a list of exam scores for hundreds of students, a Pivot Table can quickly calculate averages, identify top performers, or categorize results by grade levels.
Why Should Students Learn Pivot Tables?
- Saves Time: Quickly analyse large data sets without manual calculations.
- Boosts Academic Work: Easily organize project data, research findings, and expense tracking.
- Prepares for Careers: Pivot Tables are widely used in industries like business, marketing, and data science.
Step-by-Step Guide to Create a Pivot Table
- Prepare Your Data
Before creating a Pivot Table, ensure your data is clean and well-organized:
- Ensure all columns have headers.
- Remove blank rows or cells.
- Insert a Pivot Table
- Open your dataset in Excel.
- Highlight the entire dataset.
- Go to the Insert tab and click on Pivot Table.
- Choose where to place your Pivot Table (new worksheet or existing).
- Drag and Drop Fields
- In the Pivot Table Fields panel, drag columns into Rows, Columns, and Values sections.
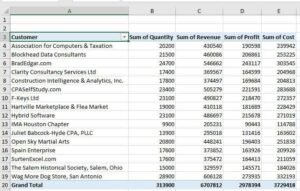
For example:- Drag “Customer Names” to Rows.
- Drag “Quantity, Revenue, Profit, and Cost” to Values (it will automatically calculate the sum or average).
- Customize Your Pivot Table
- Add filters to narrow down data.
- Format your table for better readability.
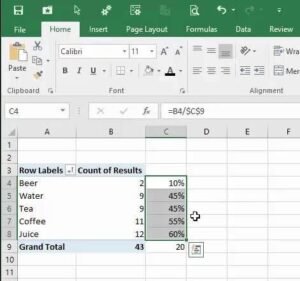
- Create charts or graphs from your Pivot Table for visual analysis.
Example Use Case:
Imagine you’re tracking expenses for a student club. A Pivot Table can group expenses by category (e.g., food, travel, supplies) and calculate totals for each category.
Common Mistakes to Avoid
- Missing Headers: Always include column names; Pivot Tables rely on them.
- Incomplete Data: Blank cells or rows can cause errors.
- Wrong Field Placement: Dragging fields into the wrong sections may yield confusing results.
Real-World Applications for Students
- Grade Analysis: Summarize scores to find averages or highest grades.
- Expense Tracking: Organize and analyse your monthly spending.
- Survey Results: Summarize responses for a class project or research.
Ready to Master Pivot Tables? Join Our Course!
Learning Pivot Tables is easier with the right guidance. Our course goes beyond basics, covering advanced tips and tricks to make you Excel pro. With hands-on projects and expert instruction, you’ll gain the skills you need to excel academically and professionally.
Enroll Now and take the first step towards data mastery!
FAQs
Q: Do I need prior Excel experience to learn Pivot Tables?
A: No! Pivot Tables are beginner-friendly, and our course starts with the basics.
Q: Can I use Pivot Tables in Google Sheets?
A: Yes, Google Sheets also supports Pivot Tables with similar functionality.
Q: What industries use Pivot Tables?
A: They’re widely used in fields like finance, marketing, research, and education.